Spatial Forces, Spatial Relationships
My friends at Liverpool University’s Civic Design Department have just published these superb spatial maps, using brand new UK census data. I’ll be adding a selection with some analysis over the next day or two.
They are the loving work of cartographic guru Dr. Alex Singleton. Alex has run the data for every local authority in the country – and it’s all available free via his website: www.alex-singleton.com.
You can down load the ‘atlas’ for Liverpool here: http://138.253.67.7/~alex/downloads/openatlas/E08000012.pdf
Also Manchester: http://138.253.67.7/~alex/downloads/openatlas/E08000003.pdf
Sheffield: http://138.253.67.7/~alex/downloads/openatlas/E08000019.pdf
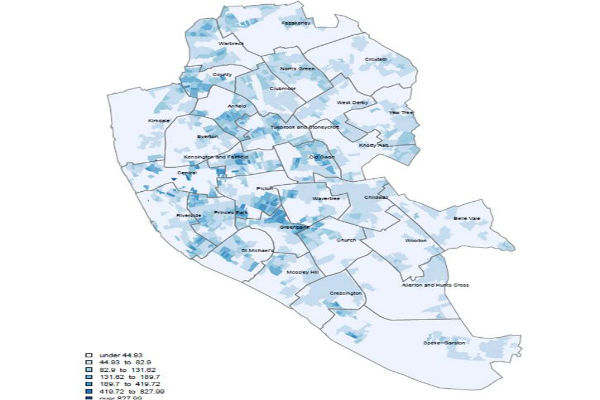
Liverpool Population Density from 2011 Census
Above is Liverpool’s population density distribution – you can clearly see the neighbourhoods of classic terraced streets around Walton (County ward), Anfield, Kensington, Toxteth (Princes Park) and Smithdown-Penny Lane (Picton and Greenbank).
Look more closely and you can see Liverpool’s distinctive radial pattern, with ‘fingers’ of density spanning out from the city centre along County Road, Kensington, Princes Avenue, Smithdown and Park Road/Aigburth Road.
There are a few clusters of high population density quite a distance from the city centre, such as Fazakerley in the far north, and Garston (Cressington ward) in the south end.
There is also stark evidence of 1960s and 70s housing clearance in the large low density gaps in and around the city centre (Central, Riverside, Kirkdale and Everton wards). During this period some 70% of inner city housing was removed, and 166,000 residents relocated to distant new towns and estates beyond the urban boundary.
If Liverpool is to sustain its new population growth (up 6% since 2001 – the first rise in 80 years, and the largest since the 19th century), these inner city areas, and the former dockland waterfront, are the gaps waiting to be refilled.
Good to see Alex getting some kudos for his work – this from Guardian online, February 8th 2013: http://www.guardian.co.uk/news/datablog/2013/feb/08/census-data-mapped
Thanks Sarah-Jane – it’d be great to see a timeline of these spatial plans over the decades, to see how population patterns ebb and flow.
It’s hard to achieve as the geographical data sets don’t always stay consistent from one census to the next.
Interesting, useful – graphic representation is a powerful tool. Been looking at against knowledge of historic environment spatial studies and it clearly sets a good base for research on people and place, including engaging the people, of course!
Thanks for your comments – very glad you are finding Dr. Singleton’s amazing UK Census Atlas useful.
This is really interesting to look at and see population density and disparity. Having lived through 7 years of regeneration scheme in Edge Hill and observed hundreds of houses standing empty from anything up to 5 years (and i know there are so many more in other areas standing empty for anything up to 15 years) … homelessness could be eradicated, it really could.
Very interesting to see the relatively large areas of low population density within the city boundary but difficult to identify exactly where the highs and lows are on the ground. No doubt the link to the source website will enable me to study this further. Hopefully it will also be possible to access similar analyses of the population distribution from earlier censuses to illustrate the changing patterns over say the last 40 or 50 years.
Jonathan makes the really good point that this 2011 Census data can help inform debate on which areas have the greatest potential for development in the near future.
Roger Brown
Thsi is such a great resource. Last week I was sniffing around to find out if anyone had done this for my case study areas. But couldn’t find much and was resigning myself to the idea of doing it myself. Now I have all parameters for Cambridge and Manchester case study!
Bonza!